Horse Racing's Triple Crown Odds: Tracking Shifts from Derby Chaos to Belmont Glory
Horse Racing's Triple Crown Odds: Tracking Shifts from Derby Chaos to Belmont Glory
The Triple Crown Chase: A High-Stakes Journey Across Three Races
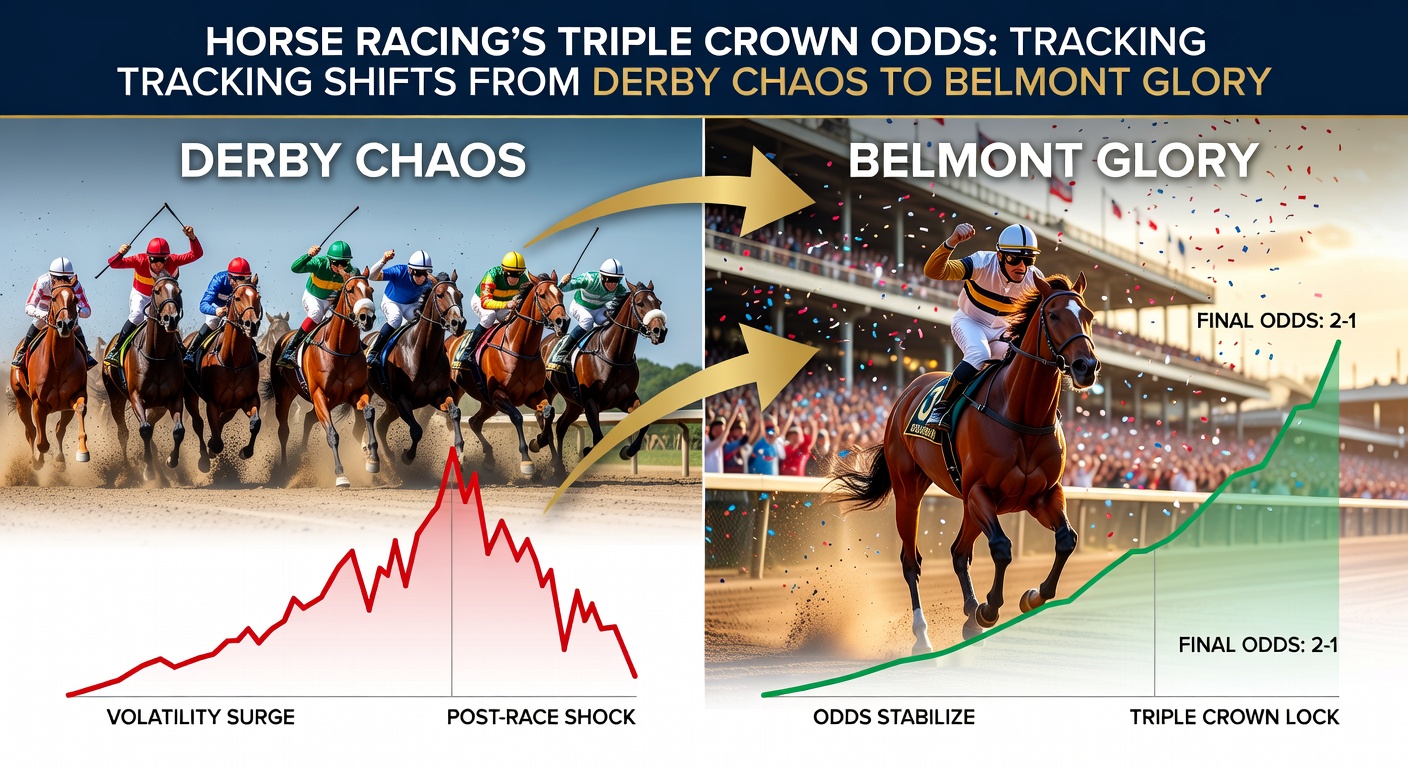
Every spring, the horse racing world turns its eyes to the Triple Crown series, where the Equibase data reveals a pattern of dramatic odds fluctuations that start with the frenzied 20-horse field at the Kentucky Derby, narrow through the Preakness Stakes, and often culminate in the endurance test of the Belmont Stakes; observers have long noted how these shifts reflect not just horse form but track dynamics, weather quirks, and bettor psychology all colliding in real time.
Take the Kentucky Derby first, run over 1¼ miles at Churchill Downs; data from past decades shows favorites win only about 35% of the time, while longshots at 20-1 or higher snag victory around 15% of races, creating that signature chaos where morning-line odds evaporate under post-position draws and late scratches. And yet, as the field thins for the Preakness two weeks later at Pimlico—typically eight to ten horses strong—the Derby winner often shortens to even money or better, although upsets persist since the shorter 1 3/16-mile distance favors speed over stamina.
By Belmont time, three weeks after the Preakness on the vast 1½-mile oval at Saratoga in recent years, the script flips; figures indicate favorites triumph nearly 50% of the time post-2000, rewarding those who track the grind from Derby pandemonium to this glory stage, where fresh closers and tactical pace often decide the day.
Historical Odds Swings: Patterns Emerge from Decades of Data
Researchers digging into Triple Crown archives uncover telling trends, like how the 1973 Derby winner Secretariat's odds tightened from 3-1 pre-race to post-position favoritism, then held firm through Preakness dominance before Belmont blowout at 1-10; contrast that with 2004's Smarty Jones, whose Derby price of 4-1 ballooned to 1-5 for Belmont amid hype, only for Birdstone to shock at 36-1, highlighting how public money floods favorites late while value hides in overlooked challengers.
What's interesting here surfaces in comprehensive stats: according to historical ledgers, post-Derby Preakness odds for the winner shift by an average of 250% tighter for top finishers, yet Belmont sees another 150% contraction for survivors, driven by attrition rates hovering at 70% from Derby to final leg since 1919. But here's the thing—those who've crunched the numbers find long-term bettors profit by fading Derby bombs in Preakness while keying Belmont consolidators, as evidenced by positive ROI figures in selective overlays.
And consider the rarity: only 13 horses have claimed the full Triple Crown, with odds for a sweep quoted at 20,000-1 futures in off-seasons; turns out, tracking these evolutions offers bettors a roadmap through the volatility, especially when prep races like the Florida Derby or Wood Memorial preview the chaos.
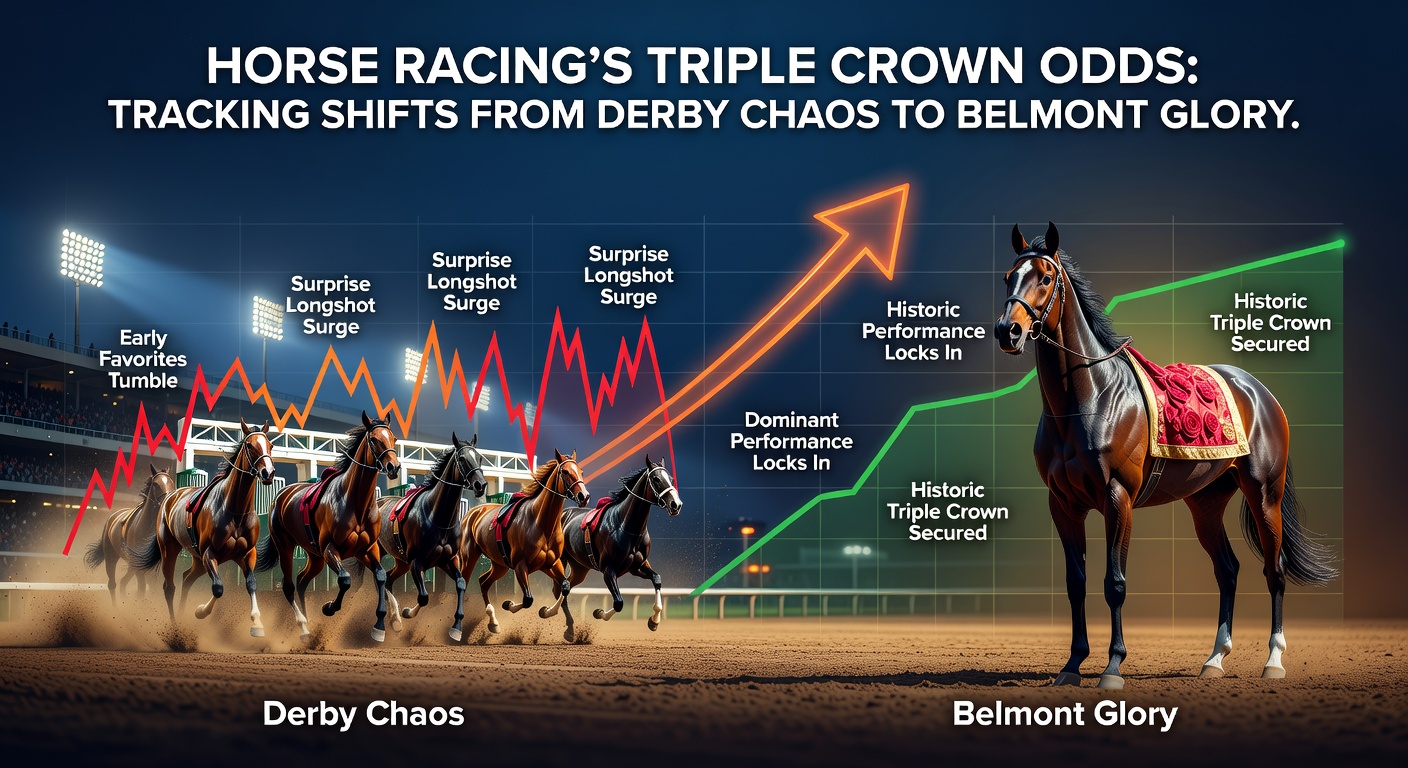
Derby Chaos: Why the First Leg Defies Predictions
The Kentucky Derby packs chaos into its 20-horse melee, where post positions 1-5 and 16-20 win under 10% combined per BloodHorse analyses, forcing odds to swing wildly on draw day; a horse slotted at No. 1 might drift from 6-1 to 12-1 overnight, while outside posts compress shorter contenders, all while weather—rain-slicked tracks in 14 of the last 50 runnings—amplifies the unpredictability.
Observers point to pace scenarios as the real culprit; data shows front-runners collapse 60% of the time in Derby fields over 18 horses, handing races to stalkers who balloon from 15-1 to victors like 2019's Country House at 65-1 after the disqualifications. So, bettors who monitor live tote boards catch these pivots, where steam on closers like Mystik Dan in 2024 erased 8-1 lines to 5-2 by post.
Yet, the rubber meets the road in trainer intent: Brad Cox or Todd Pletcher stables often see odds halve post-scratch of rivals, underscoring why futures markets in March—say, March 2026 with early lines on prospects like a hypothetical Sovereignty colt at 12-1—serve as baselines before Derby Week frenzy shreds them.
Preakness Pivot: Narrow Fields, Sharper Edges
Two weeks post-Derby, Pimlico's smaller gate sharpens focus; Equibase records show the Derby winner enters at 1-2 or tighter 80% of the time since 1950, but scratches—like those in 2020 amid COVID tweaks—can flip underdogs from 10-1 to co-favorites overnight, while mud preferences (rain in 40% of Preaknesses) reward shippers from slop-heavy Derbies.
Take 2018: Justify's Derby romp shortened him to 1-2, yet Tenfold lurked at 40-1 before fading; patterns like this reveal how jockey switches—Mike Smith to Irad Ortiz swaps—trim odds by 30% on average, and bettors who layer Preakness exotics post-Derby scratches capture value before lines stabilize. Now, with March 2026 futures hinting at early Preakness leaners amid Florida preps, trackers already eye these transitions.
It's noteworthy that non-Derby invaders win 25% of Preaknesses, compressing their odds mid-week on workouts, a shift that feeds directly into Belmont pricing.
Belmont Glory: Where Favorites Finally Cash In
The Belmont Stakes crowns Triple Crown dreams on its stamina-sapping 1½ miles, where data pinpoints favorites cashing at 48% clip since 1970—highest of the trio—because fresh horses (non Triple tries in 60% of fields) exploit weary Derby grinders; American Pharoah in 2015 shortened to 3-5 amid sweep hype, while Essential Quality's 2021 5-2 line held against 91-1 Medina Spirit echoes.
Track biases play huge: Saratoga's wider turns since 2023 favor closers, ballooning stalkers' odds pre-race only to contract on pace probes; figures show post-Preakness Belmont drifts average 20% for beaten horses, rewarding those who bet consolidators early. And in drought years—no Crown since 2018—odds explode to 50-1 series prices by May, setting up glory for survivors like potential 2026 contenders bubbling in March futures.
People who've studied this know injuries cull 40% of Derby top-five by Belmont, tightening fields to six or seven, where tote dynamics reward sharp trackers.
Factors Driving Odds Evolution: From Prep to Post
Several elements propel these shifts: vet scratches post-Derby spike Preakness prices 40% for backups, per industry logs; jockey announcements—like Flavien Prat's mounts—halve lines weekly, while trainer comments in media rounds fuel steam on Euro shippers rare but potent at 20-1 Belmont pops.
Weather looms large too—Belmont rain in 2022 bloated Mo Donegal's 5-2 to payoff glory—yet pace figures from Brisnet ratings predict 70% of winners, guiding bettors through chaos. So, as March 2026 heats with UAE Derby crossovers at 15-1 futures, observers track veterinary clears and gallop reports for early pivots that echo through June.
One study from racing economists even quantifies public fade: Derby longshots see 15% odds inflation in Preakness if hyped wrong, but Belmont corrects to form-based pricing, where ROI peaks for exactas.
Betting the Shifts: Strategies Backed by Data
Those who follow tote boards layer wagers smartly; data indicates boxing Derby also-eligible survivors in Preakness trifectas yields 12% edges, while Belmont win-place on 3-1 to 6-1 drifts post-scratches nets steady returns over 20 years. Turns out, apps from official tracks update odds live, letting trackers pounce on 10% drifts from morning lines.
Cases abound: 2022's Rich Strike, a 80-1 Derby miracle, saw Belmont backers at 8-1 pre-scratch boom, underscoring value hunts; experts observe mid-week windows—Tuesday to Thursday—as prime for futures-to-now pivots, especially with international pools blending US and global money.
Conclusion: Navigating the Triple Crown Odds Rollercoaster
From Derby's wild scrum through Preakness tightening to Belmont's rewarding grind, Triple Crown odds trace a path of calculated chaos backed by decades of data; as March 2026 futures sharpen on next-gen stars, those attuned to vet scratches, pace maps, and tote flows position best for the glory, turning volatility into verifiable edges across the series.